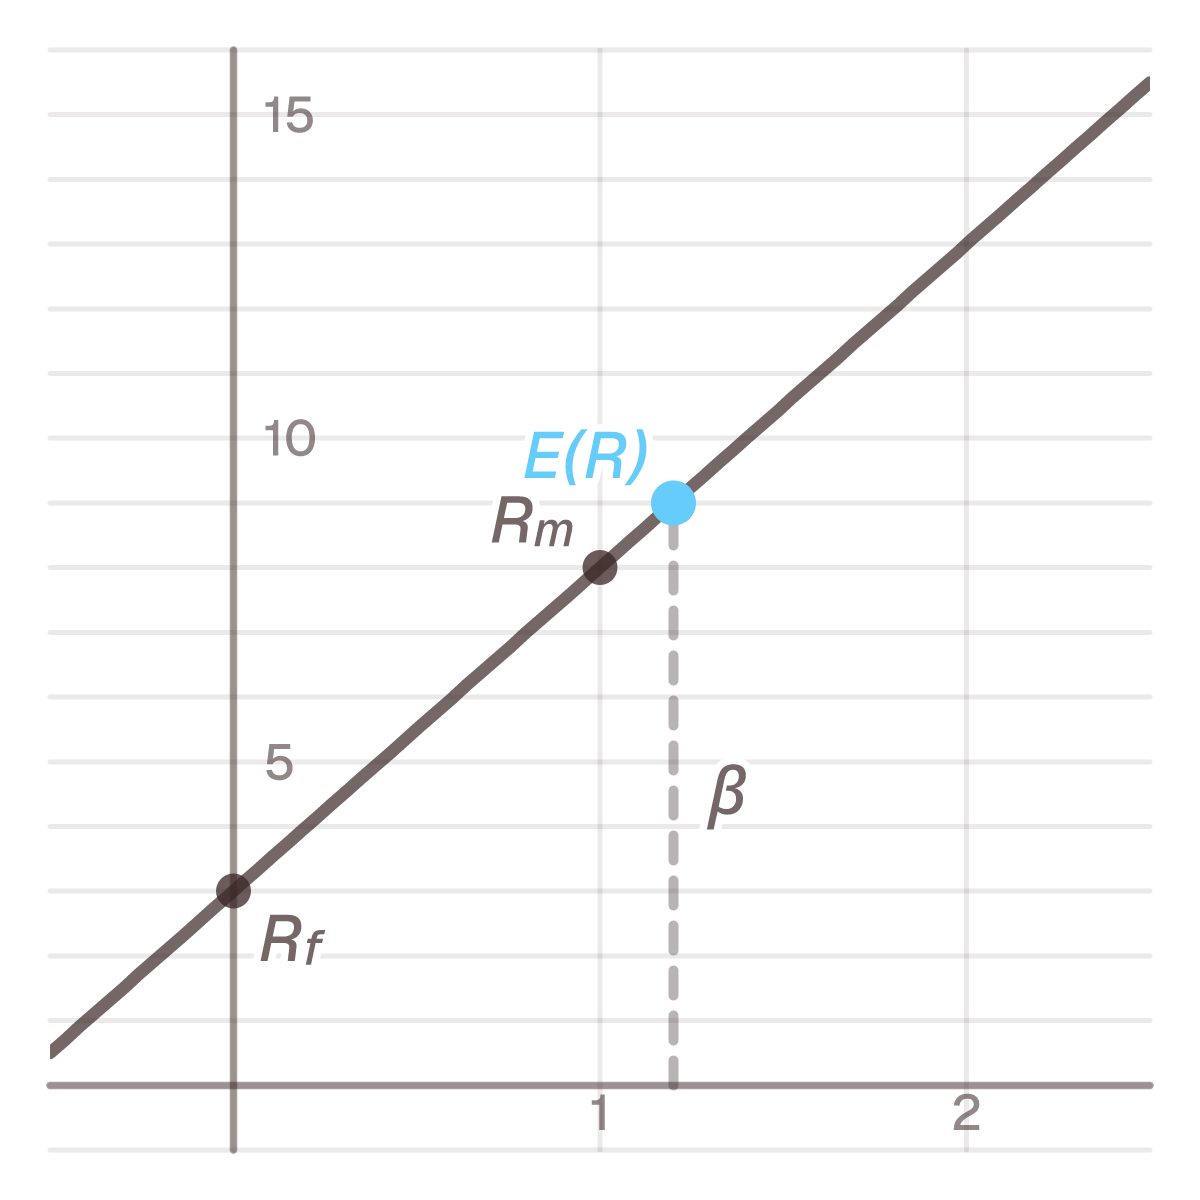
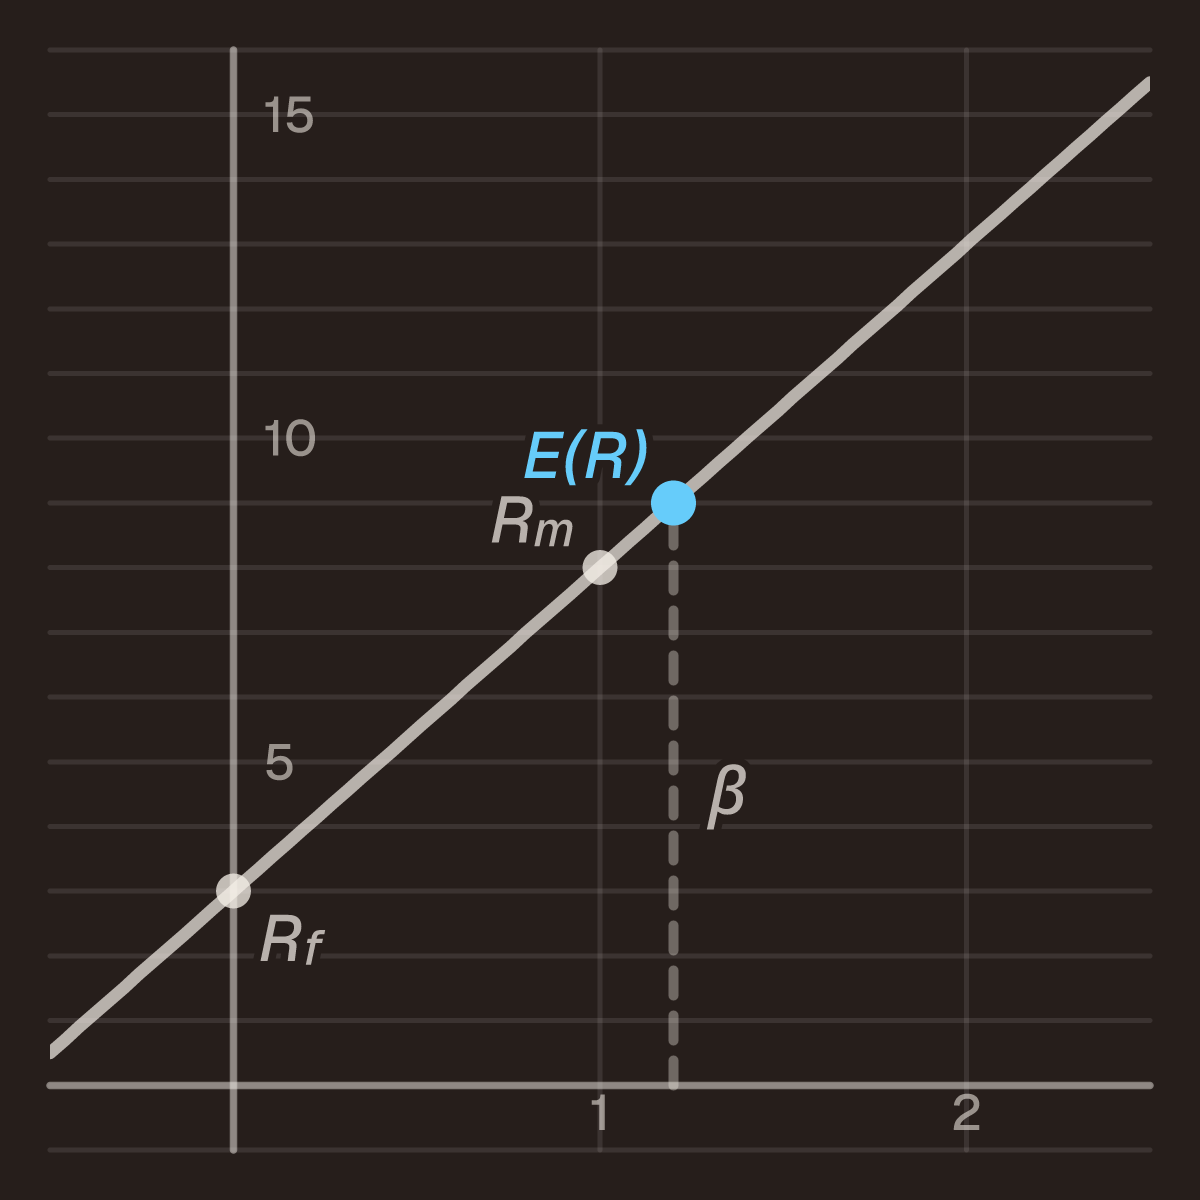
- E(R) = R_f + β · (R_m − R_f)
R_f is the risk-free rate, R_m the expected return on the market as a whole, and β (beta) how strongly the
investment moves with the market. All rates in per cent.
Risk-free rate 3%, market return 8%, beta 1.2: E(R) = 3 + 1.2 · (8 − 3) = 3 + 6 = 9%.
Read it in two parts. Everyone gets the risk-free 3% for waiting. On top of that comes a premium for risk:
the market pays 5 points over risk-free, and a share that swings 1.2 times as hard as the market earns
1.2 times that premium.
Beta multiplies the premium, not the market return
A common wrong answer is 1.2 · 8 = 9.6%, or 3 + 1.2 · 8 = 12.6%. Beta scales the
excess return, R_m − R_f, because the risk-free part is paid regardless of risk. A share with beta 0 —
one that does not move with the market at all — should earn exactly the risk-free rate, and only the
correct form gives that.
What different betas give
| Beta |
Expected return (R_f 3%, R_m 8%) |
| −0.3 |
1.5% |
| 0 |
3.0% |
| 0.5 |
5.5% |
| 1.0 |
8.0% |
| 1.2 |
9.0% |
| 2.0 |
13.0% |
Beta 1 gives the market return — the share is the market, as far as risk goes. A negative beta, such as
gold at some times, gives less than risk-free: an asset that rises when everything else falls is worth
holding for the insurance alone.
Where it is used
CAPM is the usual way to set the cost of equity R_E in WACC,
which then becomes the discount rate in net present value.
The Gordon growth model gives a second estimate from
the share price itself. Compare either with the return on investment
actually achieved.
Common mistakes
- Beta times the market return. See above.
- The market premium given, used as the market return. If a problem says “the market risk premium is
5%”, that already is R_m − R_f: E(R) = 3 + 1.2 · 5.
- Treating the answer as a forecast. CAPM says what return the risk requires, not what the share will
do.
Questions people ask
What does CAPM stand for?
Capital Asset Pricing Model, developed in the 1960s by Sharpe, Lintner and Mossin.
Where does beta come from?
From a regression of the share’s past returns on the market’s. Financial data sites publish it, and
different sites get different numbers depending on the period and the index used.