What the formula says
φ(x) = e^(−(x − μ)² / (2σ²)) / (σ√(2π))
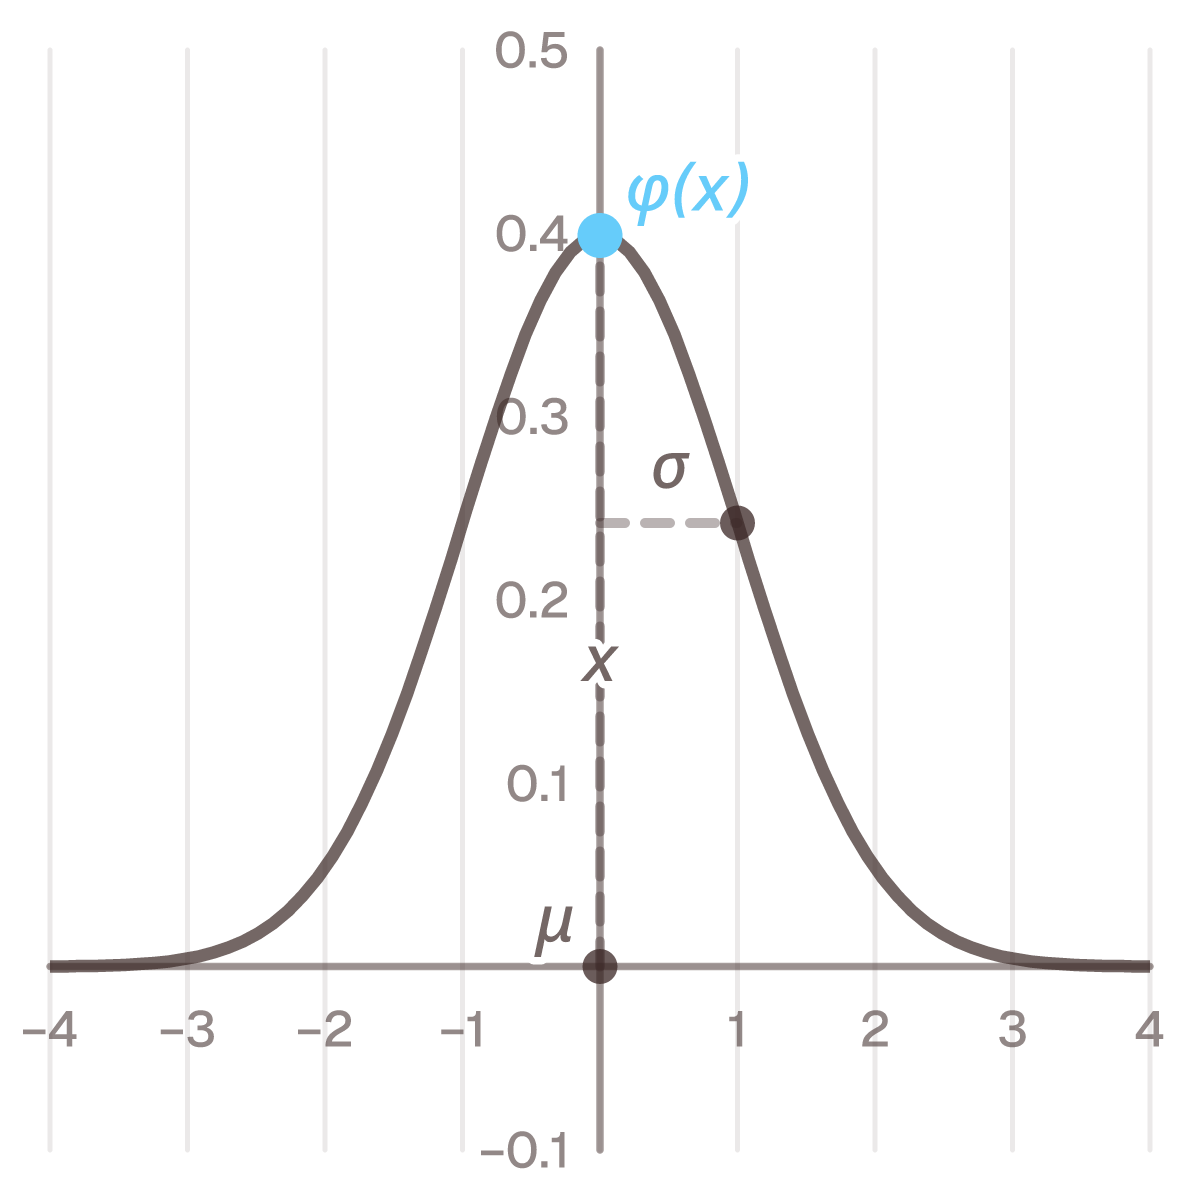
The formula gives the height of the bell curve at the point x. μ is the distribution’s mean, where the
curve peaks, and σ its standard deviation, which sets how wide the curve is.
The formula is a definition: this curve is what is called the normal distribution.
The height is called the density, and it is not a probability. The probability that a value lands in an interval is the area under the curve over that interval. That area has no simple formula, so the page stops at the height and has no calculator. To know how far from the mean a given value lies, counted in standard deviations, the z-score is what you want.
Worked examples
The peak. In the standard normal distribution, with μ = 0 and σ = 1, the height in the middle is φ(0) = 1/√(2π) ≈ 0.3989. The curve gets no higher than that.
One standard deviation out. At x = 1 the exponent is −1/2, so φ(1) = e^(−0.5)/√(2π) ≈ 0.2420. The curve has fallen to about 61% of its peak.
A density above 1. With σ = 0.1 the peak is 0.3989 / 0.1 ≈ 3.989. The curve is ten times narrower and so ten times taller, which keeps the area under it at 1.
Common mistakes
- Reading the density as a probability. The σ = 0.1 example gives 3.989, and no probability is above
- The density says how closely the values are packed, not how likely one value is.
- Expecting the formula to answer “what share lies below x”. That is the area to the left of x, not the height at x. For the standard normal and x = 1 the share is about 0.8413.
- Assuming the curve always sits at 0 with width 1. That holds only for the standard normal. A normal distribution can have any μ and any positive σ.
Common questions
How do I find a probability, not just a density?
First turn the value into a z-score, then look up the area in a standard normal table or use a
spreadsheet. The area has no formula built from ordinary functions, which is why the tables exist. A
benchmark: about 68.3% of values lie within one standard deviation of the mean.
What is the standard normal distribution?
The normal distribution with mean 0 and standard deviation 1. Every other normal distribution is the
same curve, shifted and stretched, so one table of it serves them all.
How does this relate to the z-score?
The z-score shifts and rescales a value so that it can be read on the standard normal. A value 1.5
standard deviations above the mean has z = 1.5, whatever μ and σ it came from. The
confidence interval is built on the same conversion.