Skip to content
LoveToCalc

Definition — what does that mean?

Confidence interval

How far the interval reaches either side of the sample mean.

In Swedish: Konfidensintervall (felmarginal)

Confidence interval (margin of error)

The relation

E=t·Σ(xi−x)²n−1n

How far a confidence interval reaches either side of the sample mean: the t critical value for the confidence level and n − 1 degrees of freedom, times the sample standard deviation over the square root of the count. The interval itself is the mean plus and minus this margin.

Solve for

Separate the numbers with spaces, commas or semicolons, for example 2.5, 4, 7

E≈1.7875

E equals 2.3646 times (the square root of (((2 minus 5) squared plus (4 minus 5) squared plus (4 minus 5) squared plus (4 minus 5) squared plus (5 minus 5) squared plus (5 minus 5) squared plus (7 minus 5) squared plus (9 minus 5) squared) divided by (8 minus 1)) divided by the square root of (8)), is approximately 2.3646 times (the square root of (((−3) squared plus (−1) squared plus (−1) squared plus (−1) squared plus 0 squared plus 0 squared plus 2 squared plus 4 squared) divided by 7) divided by 2.8284), is approximately 2.3646 times (the square root of ((9 plus 1 plus 1 plus 1 plus 0 plus 0 plus 4 plus 16) divided by 7) divided by 2.8284), is approximately 2.3646 times (the square root of (32 divided by 7) divided by 2.8284), is approximately 2.3646 times (the square root of (4.5714) divided by 2.8284), is approximately 2.3646 times (2.1381 divided by 2.8284), is approximately 2.3646 times 0.7559, is approximately 1.7875

Working8 steps

What the formula says

E = t · s/√n

Holds when the values are a random sample from a roughly normal population, or when the sample is large enough for the mean to be roughly normal anyway.

E is the margin of error, s the sample’s standard deviation, n the number of values and t the critical value for the chosen confidence level, with n − 1 degrees of freedom. The interval itself is the mean plus and minus the margin: x̄ − E to x̄ + E. The formula is a definition of how wide the interval is made.

The critical value comes from the t-table. It is t rather than the normal distribution’s z (1.96 at 95%) because s is estimated from the same sample: the uncertainty in s widens the interval, and the t distribution accounts for it. The larger the sample, the closer t gets to z. At 95% and 30 degrees of freedom t = 2.04, and at a few hundred degrees of freedom the difference from 1.96 is negligible.

Worked examples

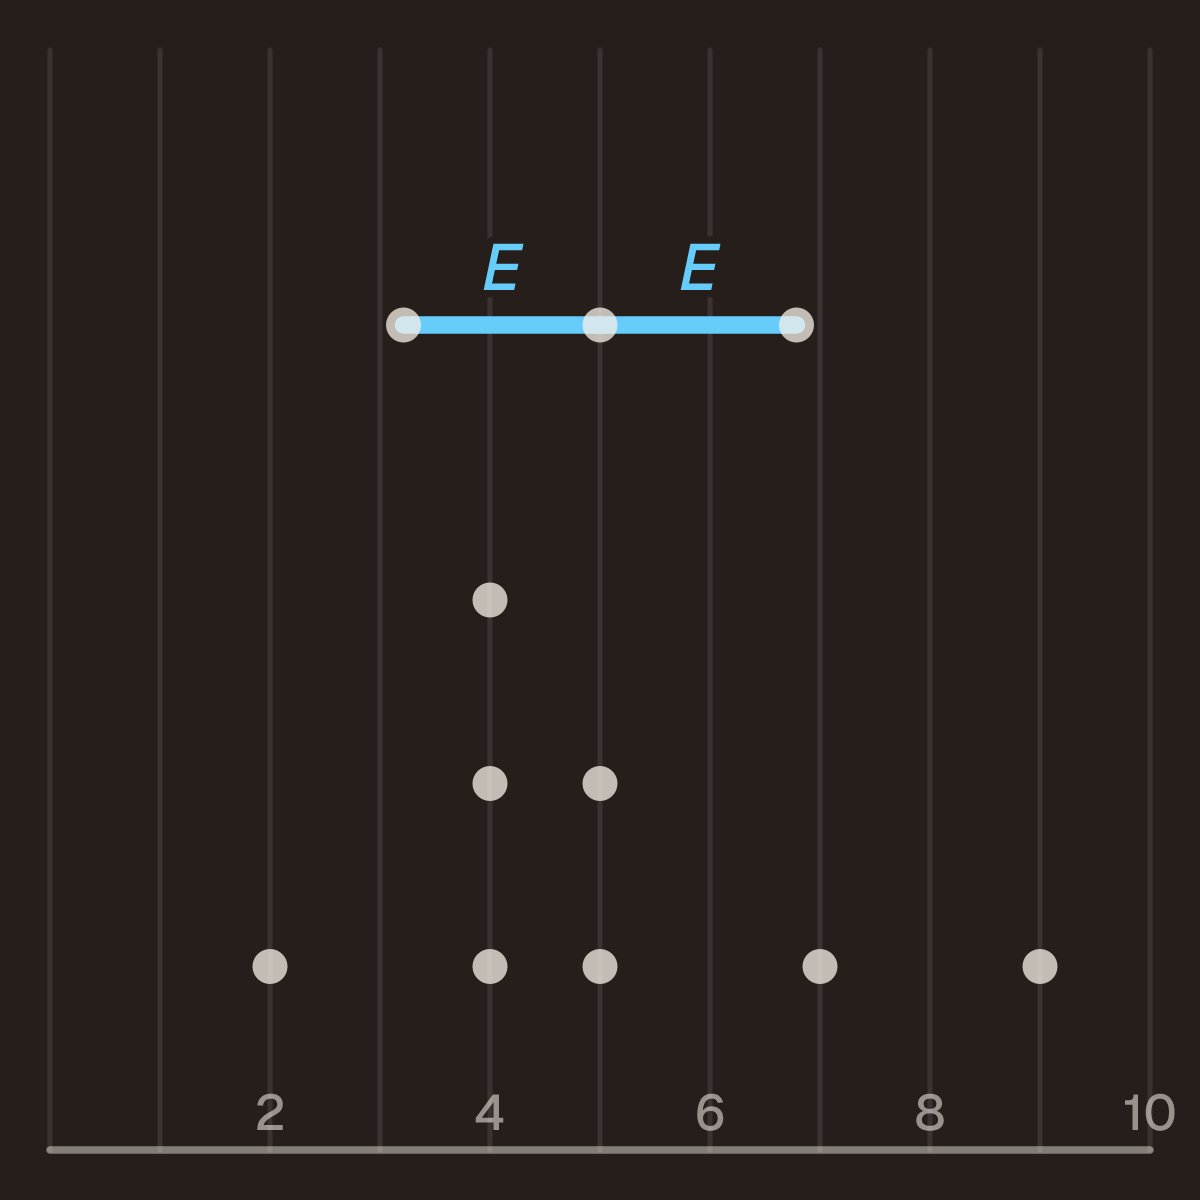
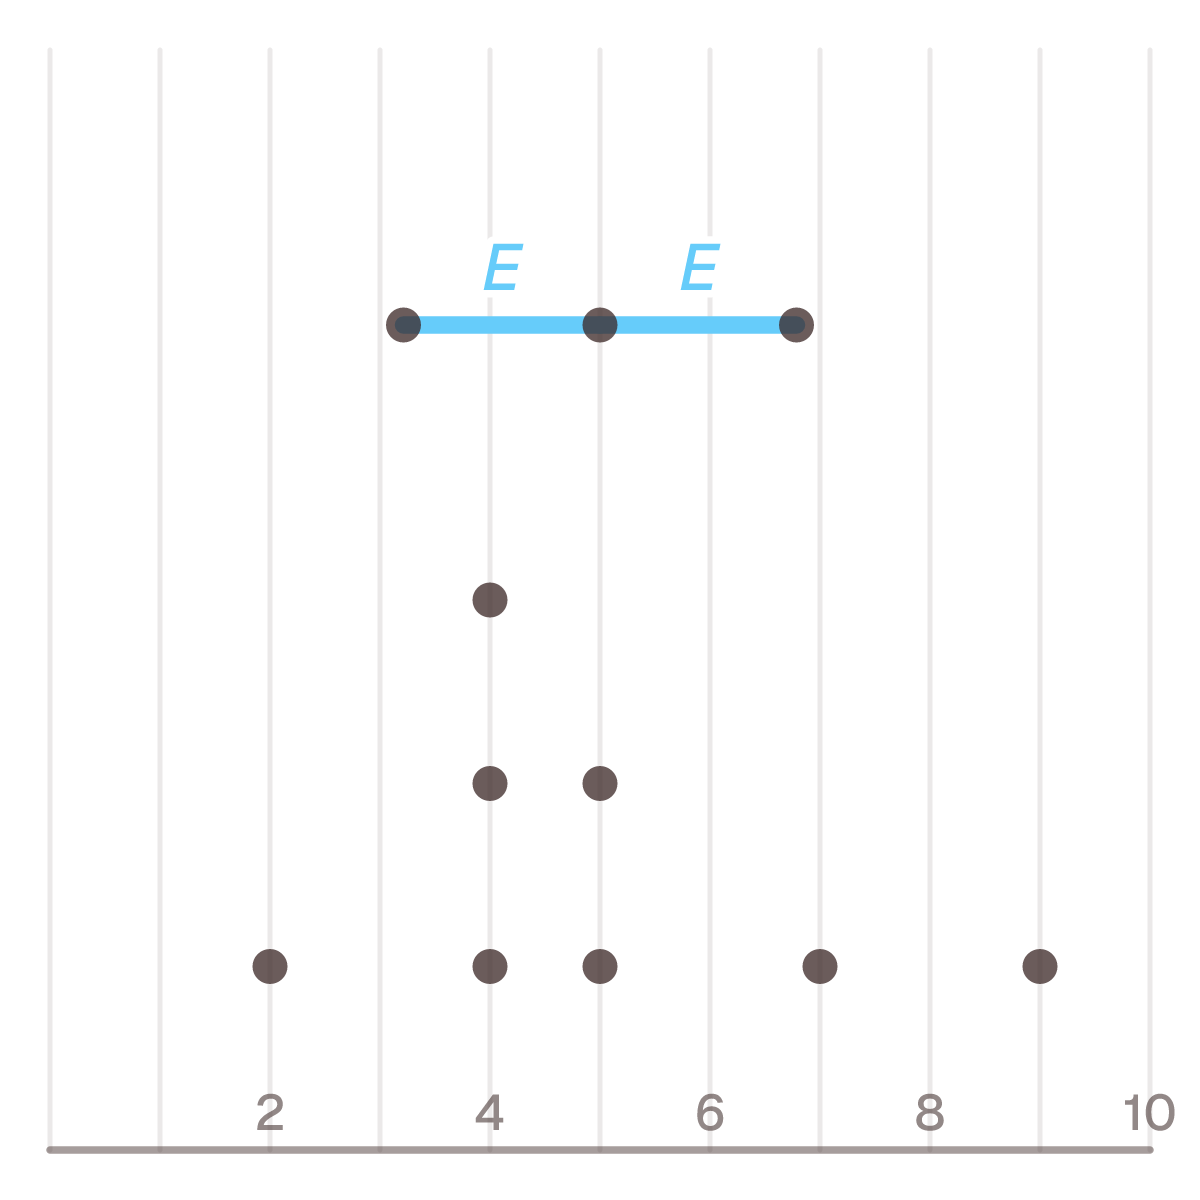
The margin at 95%. The sample 2, 4, 4, 4, 5, 5, 7, 9 has n = 8, x̄ = 5 and s ≈ 2.1381.

The interval. 5 − 1.79 = 3.21 and 5 + 1.79 = 6.79. The interval is roughly 3.21 to 6.79.

At 99%. With t = 3.499, E = 3.499 · 0.7559 ≈ 2.64, and the interval is 2.36 to 7.64. A higher confidence level gives a wider interval.

A bigger sample. Had the same spread been measured on 32 values, four times as many, s/√n = 2.1381 / √32 ≈ 0.378. With 31 degrees of freedom t = 2.040, so E ≈ 0.77 at 95%. Four times the values halves s/√n, and t shrinks too, so the margin ends up less than half.

Common mistakes

Common questions

When is z = 1.96 used? When the population’s standard deviation σ is known rather than estimated from the sample. Then 95% of the normal distribution’s area lies between −1.96 and 1.96. For 90% the matching number is 1.645, and for 99% it is 2.576. With a large sample, t is so close to z that both give nearly the same answer.

What is the actual interval, not just the margin? The mean minus the margin to the mean plus the margin. For the example above that is 5 ± 1.79, so roughly 3.21 to 6.79. The card works out the margin; the rest is one subtraction and one addition.

Why n − 1 and not n? Because the sum of squares around the sample’s own mean comes out smaller than around the population’s true mean. Dividing by n would therefore understate the spread on average, and n − 1 corrects for it. The sample variance page explains it further.
Looking for another letter? The formula solved for each one
Solved for each letter
Solve forRearrangedWith the numbersComes to
Et·Σ(xi−x)²n−1n2.3646·(2−5)²+(4−5)²+(4−5)²+(4−5)²+(5−5)²+(5−5)²+(7−5)²+(9−5)²8−181.7875
tEΣ(xi−x)²n−1n1.7875(2−5)²+(4−5)²+(4−5)²+(4−5)²+(5−5)²+(5−5)²+(7−5)²+(9−5)²8−182.3646

Standard normal table

Table

Standard normal table
z0.000.010.020.030.040.050.060.070.080.09
0.00.50000.50400.50800.51200.51600.51990.52390.52790.53190.5359
0.10.53980.54380.54780.55170.55570.55960.56360.56750.57140.5753
0.20.57930.58320.58710.59100.59480.59870.60260.60640.61030.6141
0.30.61790.62170.62550.62930.63310.63680.64060.64430.64800.6517
0.40.65540.65910.66280.66640.67000.67360.67720.68080.68440.6879
0.50.69150.69500.69850.70190.70540.70880.71230.71570.71900.7224
0.60.72570.72910.73240.73570.73890.74220.74540.74860.75170.7549
0.70.75800.76110.76420.76730.77040.77340.77640.77940.78230.7852
0.80.78810.79100.79390.79670.79950.80230.80510.80780.81060.8133
0.90.81590.81860.82120.82380.82640.82890.83150.83400.83650.8389
1.00.84130.84380.84610.84850.85080.85310.85540.85770.85990.8621
1.10.86430.86650.86860.87080.87290.87490.87700.87900.88100.8830
1.20.88490.88690.88880.89070.89250.89440.89620.89800.89970.9015
1.30.90320.90490.90660.90820.90990.91150.91310.91470.91620.9177
1.40.91920.92070.92220.92360.92510.92650.92790.92920.93060.9319
1.50.93320.93450.93570.93700.93820.93940.94060.94180.94290.9441
1.60.94520.94630.94740.94840.94950.95050.95150.95250.95350.9545
1.70.95540.95640.95730.95820.95910.95990.96080.96160.96250.9633
1.80.96410.96490.96560.96640.96710.96780.96860.96930.96990.9706
1.90.97130.97190.97260.97320.97380.97440.97500.97560.97610.9767
2.00.97720.97780.97830.97880.97930.97980.98030.98080.98120.9817
2.10.98210.98260.98300.98340.98380.98420.98460.98500.98540.9857
2.20.98610.98640.98680.98710.98750.98780.98810.98840.98870.9890
2.30.98930.98960.98980.99010.99040.99060.99090.99110.99130.9916
2.40.99180.99200.99220.99250.99270.99290.99310.99320.99340.9936
2.50.99380.99400.99410.99430.99450.99460.99480.99490.99510.9952
2.60.99530.99550.99560.99570.99590.99600.99610.99620.99630.9964
2.70.99650.99660.99670.99680.99690.99700.99710.99720.99730.9974
2.80.99740.99750.99760.99770.99770.99780.99790.99790.99800.9981
2.90.99810.99820.99820.99830.99840.99840.99850.99850.99860.9986
3.00.99870.99870.99870.99880.99880.99890.99890.99890.99900.9990
3.10.99900.99910.99910.99910.99920.99920.99920.99920.99930.9993
3.20.99930.99930.99940.99940.99940.99940.99940.99950.99950.9995
3.30.99950.99950.99950.99960.99960.99960.99960.99960.99960.9997
3.40.99970.99970.99970.99970.99970.99970.99970.99970.99970.9998

t-table

Table

t-table
df0.10.050.0250.010.005
13.0786.31412.70631.82163.657
21.8862.9204.3036.9659.925
31.6382.3533.1824.5415.841
41.5332.1322.7763.7474.604
51.4762.0152.5713.3654.032
61.4401.9432.4473.1433.707
71.4151.8952.3652.9983.499
81.3971.8602.3062.8963.355
91.3831.8332.2622.8213.250
101.3721.8122.2282.7643.169
111.3631.7962.2012.7183.106
121.3561.7822.1792.6813.055
131.3501.7712.1602.6503.012
141.3451.7612.1452.6242.977
151.3411.7532.1312.6022.947
161.3371.7462.1202.5832.921
171.3331.7402.1102.5672.898
181.3301.7342.1012.5522.878
191.3281.7292.0932.5392.861
201.3251.7252.0862.5282.845
211.3231.7212.0802.5182.831
221.3211.7172.0742.5082.819
231.3191.7142.0692.5002.807
241.3181.7112.0642.4922.797
251.3161.7082.0602.4852.787
261.3151.7062.0562.4792.779
271.3141.7032.0522.4732.771
281.3131.7012.0482.4672.763
291.3111.6992.0452.4622.756
301.3101.6972.0422.4572.750
401.3031.6842.0212.4232.704
501.2991.6762.0092.4032.678
601.2961.6712.0002.3902.660
801.2921.6641.9902.3742.639
1001.2901.6601.9842.3642.626
1201.2891.6581.9802.3582.617
∞1.2821.6451.9602.3262.576

Last reviewed October 6, 2026 ·How pages are reviewed

Statistics and probabilityAll formulas

Put this formula on your site

Copy the code into your page where the formula card should appear. It loads from lovetocalc.com, so it stays current on its own — all we ask is that the credit line comes with it.