Interquartile range
The relation
IQR
The upper quartile minus the lower quartile: how wide the middle half of the values is. Unlike the range, it ignores the extremes.
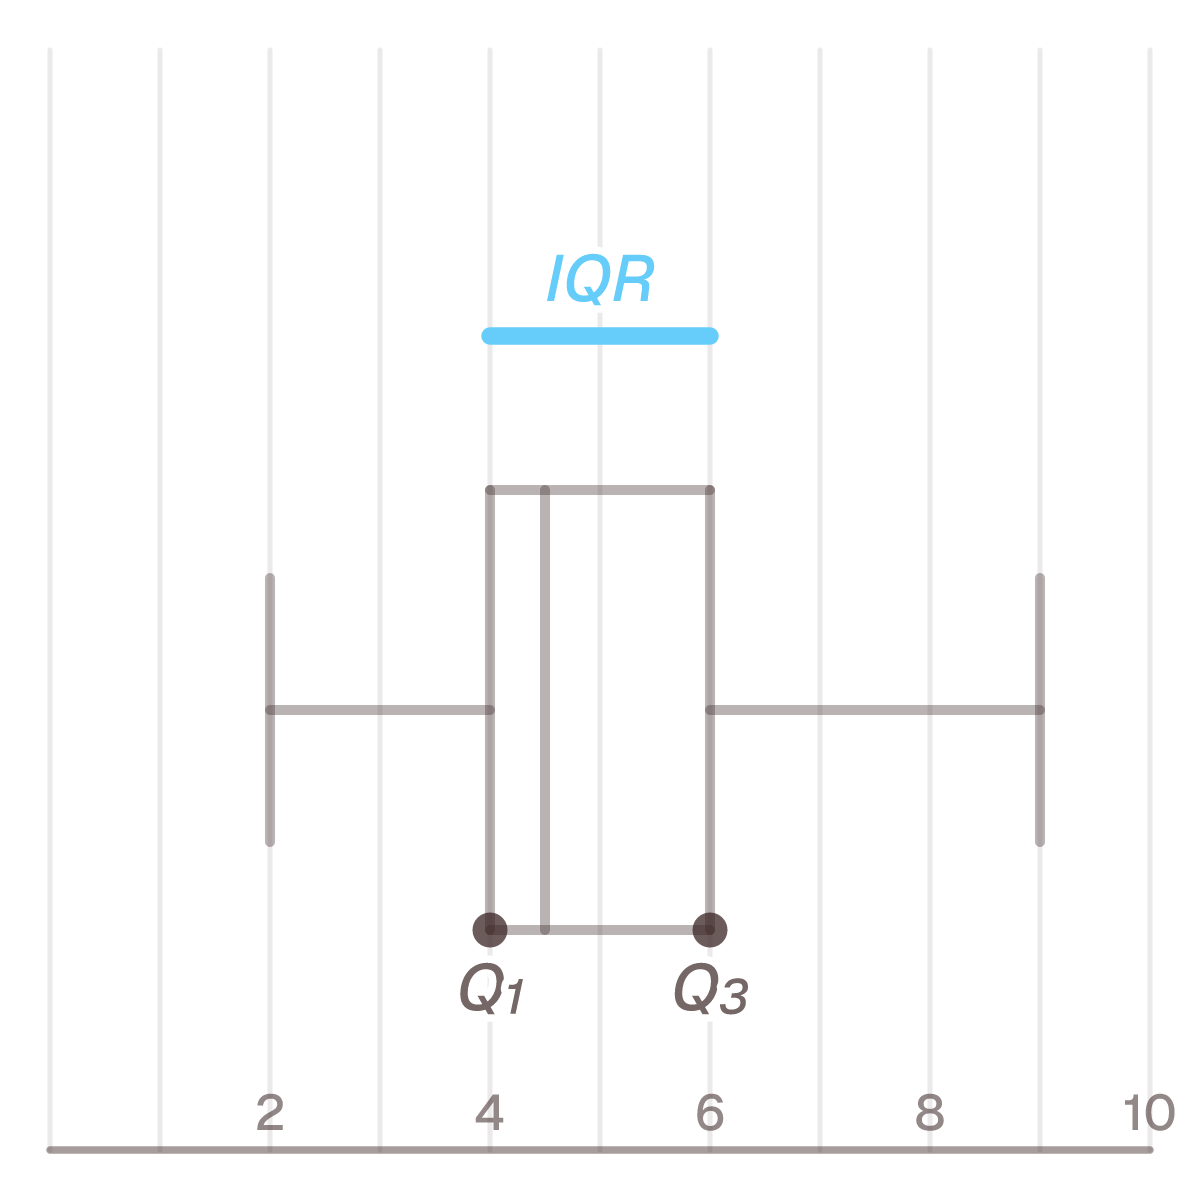
Solve for
IQR=2
IQR equals 6 minus 4, equals 2
Den här sidan finns på svenska. Byt till svenska
Definition — what does that mean?
How wide the middle half of the values is.
In Swedish: Kvartilavstånd
IQR
The upper quartile minus the lower quartile: how wide the middle half of the values is. Unlike the range, it ignores the extremes.
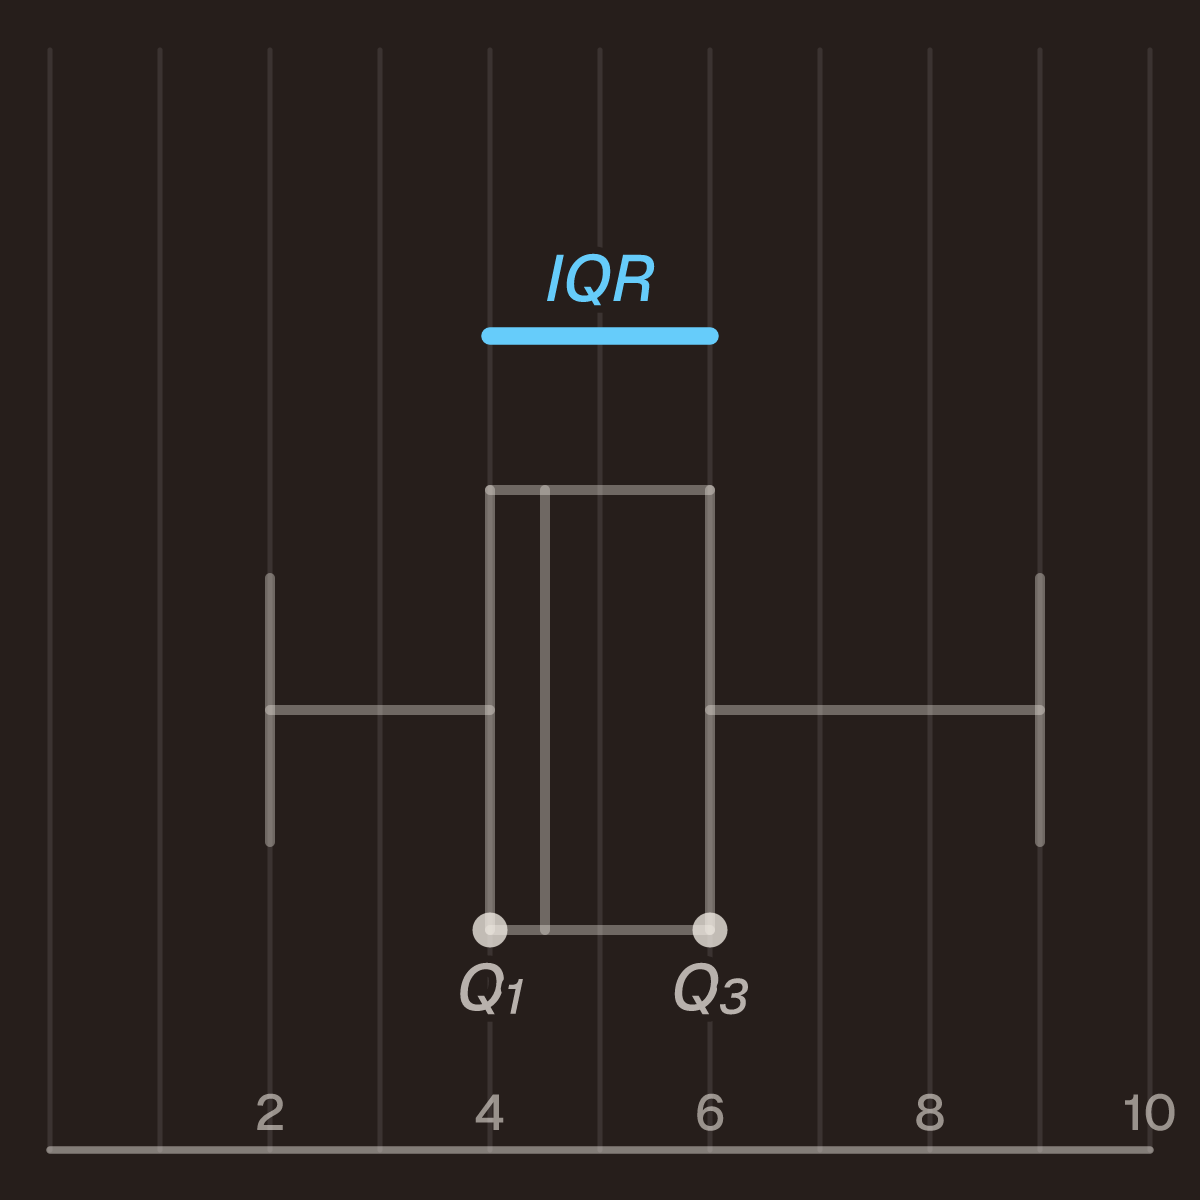
IQR=2
IQR equals 6 minus 4, equals 2
You are given
IQR = Q₃ − Q₁
The upper quartile minus the lower one. Roughly half of the values lie between Q₁ and Q₃, so the interquartile range is the width of the middle half. The formula is a definition.
Eight values. 2, 4, 4, 4, 5, 5, 7, 9 has Q₁ = 4 and Q₃ = 6 by the median of each half. The interquartile range is 6 − 4 = 2.
Replace the 9 with 100: 2, 4, 4, 4, 5, 5, 7, 100. The quartiles are still 4 and 6, and the interquartile range is still 2. The range jumps from 7 to 98.
| List | Range | IQR |
|---|---|---|
| 2, 4, 4, 4, 5, 5, 7, 9 | 7 | 2 |
| 2, 4, 4, 4, 5, 5, 7, 100 | 98 | 2 |
That is why it is used: one mistyped or unusual value can make the range say anything, while the interquartile range is unaffected.
Q₁ is 30 and the interquartile range is 12. What is Q₃? Add the interquartile range to the lower quartile: Q₃ = 30 + 12 = 42.
A box plot draws the interquartile range as its box.
Can the interquartile range be 0?
Yes, when Q₁ and Q₃ are equal — for example for 3, 5, 5, 5, 5, 5, 8, where both quartiles
come to 5.
It can never be negative.
IQR or standard deviation?
The IQR goes with the median, and the standard deviation with the mean. For skewed data or data with
extreme values, the median and IQR describe the typical values better.
What is the 1.5 × IQR rule?
A convention for flagging outliers: a value more than 1.5 · IQR below Q₁ or above Q₃ is marked as
unusual. It is a rule of thumb, not part of the definition.
| Solve for | Rearranged | With the numbers | Comes to |
|---|---|---|---|
| IQR | Q₃ | 6 | 2 |
| Q₁ | Q₃ | 6 | 4 |
| Q₃ | Q₁ | 4 | 6 |
Last reviewed October 6, 2026 ·How pages are reviewed
Statistics and probabilityAll formulas
Copy the code into your page where the formula card should appear. It loads from lovetocalc.com, so it stays current on its own — all we ask is that the credit line comes with it.